


Via Amy Burns
Get Started for FREE
Sign up with Facebook Sign up with X
I don't have a Facebook or a X account


 Your new post is loading...
 Your new post is loading...
Your new post is loading...
rodrick rajive lal's insight:
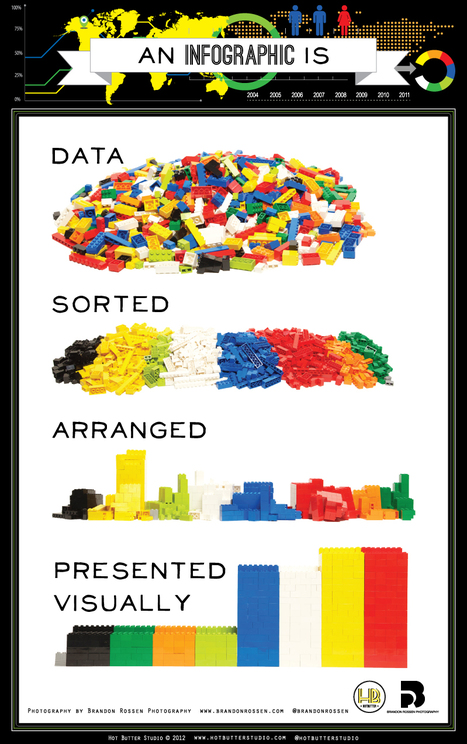
This is a very useful list of tools that teachers can use to make their class room pedagogy more interesting and effective. The four online tools suggested by the writer include: Piktochart, Easel.ly, Canva, and Google Draw. I personally use webcharts and flow charts with a start and stop button. It does take some time to draw the webchart on the Greenboard, so I guess it would save time to do the same before class and then present it on a screen. This can be done very effectively in the teaching of Languages. Take for example a plot line for a novel where you have a flow of events starting from the introduction, on to the ascending movement or the complication on to the climax, or the turning point and then the ascending movement on to the anti climax and then the denouement. This could be beautifully done in an infographic! Infographics are visual representations of data that can be used to depict pictorially, timelines, process of transformation in characters in novels, flow charts, plot lines, and information! 
|


Great suggestions for tools to use to create visually exciting infographics.
Näistä visualisointityökaluista vain Canva tuttu. Taas lisää linkkejä #pitäisitutustua listaan, mutta myös #haluanoppia